News
11th Apr. 2016.
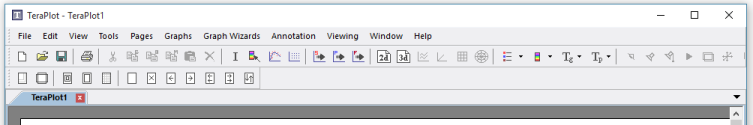
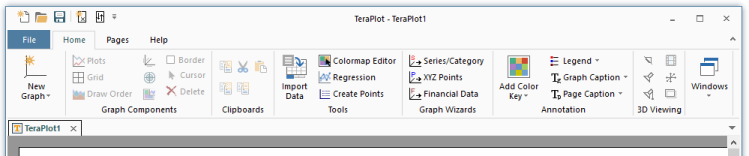
User interface changes. Prior to version 1.4, TeraPlot used the menu and toolbar interface shown in the first image below. As of version 1.4,
the program now uses the ribbon based interface shown in the second image. By and large, all of the commands that were available on the top toolbar of
the old version (and their associated menu commands) are now available from the ribbon Home tab. The only exceptions to this are File- New/Open/Save/Print
commands, which have their own File menu, and the help-related commands which have their own Help ribbon tab. Similarly, all of the commands that were
available on the lower toolbar of the old version (and their associated menu commands) are available from the ribbon Pages tab. In addition, the new
version has a Quick Access Toolbar (QAT) at the far left of the main window caption area, which contains buttons representing frequently used commands.
This contains the five buttons shown by default, but it can be customised using the drop-down menu at its right.
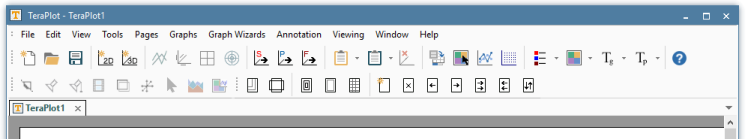
In addition to ribbon mode, the new version also supports a toolbar mode (shown in third image), similar to the old version. In the new version, the old toolbar
functionality which was spread across two toolbars, is now spread across three toolbars. Essentially, the 3D viewing operations have been given their own toolbar.
Switching between ribbon and toolbar mode is done via File-Preferences.
11th Sep 2015.
Version 1.3.03. Bug fix. Status bar information now updating correctly when a new graph is selected.
27th April 2015.
Version 1.3.02. Bug fix. Cursor feedback feature wasn't working properly for 3D graphs.
19th Jan. 2015.
Points Generation Feature. Release 1.3.00 adds the Points Generation Dialog. This dialog can be
used to generate points for use in plots that take a set of 1D, 2D, or 3D points as input, for example the 2D and 3D scatter plots,
and the irregular data surface and contour plots. Multiple "grids" of points in one, two or three dimensions can be specified, and the points
generated to a table. The points can then be copied for subsequent pasting, or exported to a file. In 2D, points can be generated
in cartesian or polar coordinates. In 3D, points can be generated in cartesian, polar or cylindrical coordinates. Points can also
be randomized in one, two, or three dimensions, allowing for the generation of random points over a cartesian or polar area,
or within a cartesian, polar or cylindrical volume.
Analytical 3D Scatter Plot. In addition to the tabular option, the 3D Scatter Plot can now be defined analytically.
11th Sep. 2014.
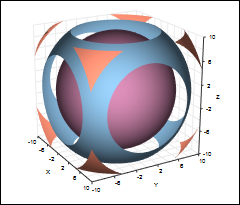
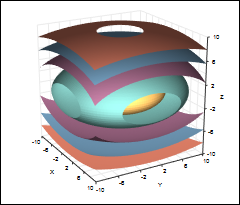
New plot type - isosurfaces. Release 1.2.00 adds an isosurface plot type. For a function of the form w = f(x, y, z),
isosurfaces are surfaces of constant w. The plot can be based on a mathematical formula (analytical plot), or on data loaded
from a file. For an analytical plot, the data is assumed to lie on a regular rectangular 3D grid. For data loaded from a file,
the data can either lie on a regular grid, or arbitrary individual cells can be specified.
2nd June 2014.
Version 1.1.01. Minor bug fixes. Upgraded software projects to Microsoft Visual Studio 2013.
27th Jan. 2014.
Antialiasing Improvements. As of version 1.1.00, TeraPlot now uses OpenGL multisampling for antialiasing in 3D graphs. Antialiasing is
the process that removes the potentially unsightly jagginess on diagonal edges. The visual improvement gained by antialiasing can be seen in the figure
on the right below (where it's on), compared to the one on the left (where it's off). In previous versions, antialiasing was off by default. This was
necessary because it required multiple renders, which could be time consuming, so it was only made available optionally via a toolbar button.
The new approach uses the multisampling facility provided by the display card, which is fast, and means that antialising can be used by default on
all 3D graphs. This means that the antialias button won't appear on the toolbar any more. The only exception to this is where TeraPlot is installed
on PC's which don't support multisampling. It's very unlikely that your PC display card doesn't support multisampling, so the only situation it's
likely to arise is when TeraPlot is installed on virtual PC's, which tend not to support multisampling. In such situations, the antialias button
will appear on the toolbar, antialiasing will be off by default, and the previous multiple render approach will be used to perform antialiasing.