Overview
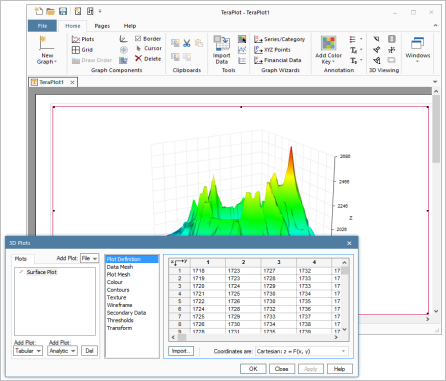
The figure on the right shows a typical graph plotting scenario, where a graph containing a 3D surface plot has been created at the top
of the first page of a TeraPlot project. Each project gets its own document window within a multiple document type
interface. A project can contain multiple pages, and pages can contain multiple graphs. Also, graphs can be arbitrarily positioned and sized on a page. The page
on which the graphs are laid out is a correct representation of the printer page, ensuring that any printed graph
will look exactly as displayed on the screen, a feature rarely found in other graph software. Also shown is
the Plot Dialog, which is used to specify the plot data
and parameters. The Plot Dialog consists of three parts: a list of the names of the plots that have been added to the
graph on the left, a list of available property pages for the currently selected plot in the middle, and the currently
selected property page on the right. The property pages contain all of the properties that can be modified for the
currently selected plot. All of the most commonly used graph creation and page manipulation options are available from
the two toolbars at the top of the main window.
View a slideshow of the steps involved in creating the graph on the right
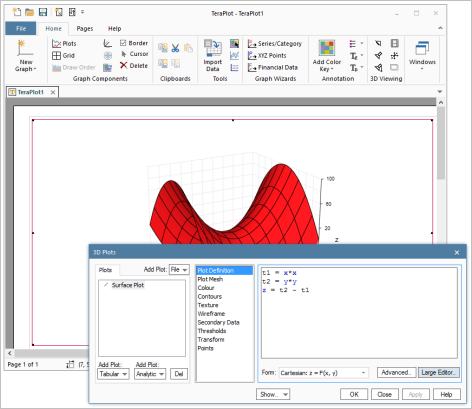
The plot in the graph above was based on tabular data. TeraPlot can also create plots based on mathematical expressions, and
both types of plot can be combined in the same graph. Plots based on mathematical expressions are termed "analytical plots",
and are defined using one or more expressions in the VBScript scripting language. Plots can be defined using various coordinate systems,
and combined in the same graph. Typical coordinate systems are cartesian, polar and parametric
for 2D plots/graphs; cartesian, spherical, cylindrical, and parametric for 3D plots/graphs. In the figure on the left, a graph with a plot of z = y2 - x2
has been created over the range -10 to 10 in both of the graph x and y directions. To illustrate the fact that the plot definition can consist of
multiple expressions, the subexpressions x2 and y2 have been defined as separate terms t1 and t2, before subtracting
t1 from t2 to create the final plot definition. VBScript provides all common math functions, and TeraPlot graph software additionally allows you
specify your own functions in a file which is read from disk when the program starts.
View a slideshow of how TeraPlot graph software was used to create the graph on the left