Data Analysis
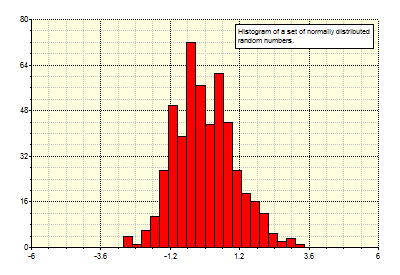
TeraPlot provides data analysis capabilities in the form of statistical functions and standard statistical analysis plots such as histograms,
box plots, probability plots, and linear and nonlinear regression. The graph on the right shows a typical histogram plot. The histogram
plot can be used to report Mean, Median, Variance, Standard Deviation, Skewness and Kurtosis.
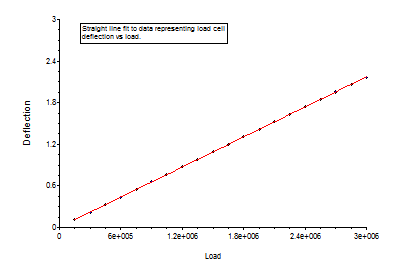
The Regression plot can be used to fit data to certain predefined plot types using linear regression. The most common example is a least-squares
fit to a straight line y = ax +b, but other plot forms are available, i.e. exponential, power, reciprocal, and polynomial. The resulting fit is
displayed as a plot of the original data points plus the fitted line, as shown in the graph on the right. The line coefficients a and b are reported along with a "goodness of fit"
measure. A table of the original x and y points, along with the associated fitted points an residuals is also given.
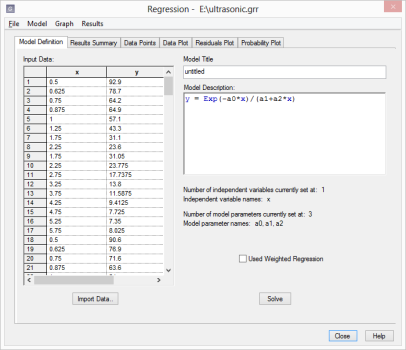
TeraPlot provides a multidimensional nonlinear regression facility which can be used to fit data to a general functional form using the Levenberg-
Marquardt Method. The Nonlinear Regression dialog (right), although a dialog, is more of a program in its own right. It has its own menu bar, its
own document type, and multiple windows, accessed via tabs, for data input and results display. In the figure on the right the main regression dialog
window shows the table containing the input data, and to its right, the model description to which the data is to be fitted. In this case, the
model contains one inependependent variable, x (hence the two-column table), and three model parameters: a0, a1, a2. After all data and model have been
fully defined, the calculation is started by pressing the Solve button. After the calculation is complete, the results are available for viewing in the
other dialog pages.
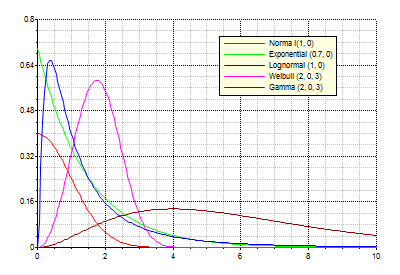
The Statistical Distribution plot can be used to plot statistical distributions (either PDF or CDF) based on supplied distribution parameters.
This graph illustrates Normal, Exponential, Lognormal, Weibull, and Gamma distributions.