Automation
Automation provides the ability to remotely start TeraPlot via a driver program written in e.g. VB.Net or C#. Using this approach, much of the menu-driven functionality which would normally be accessed manually can be accessed and manipulated programmatically. Automation is therefore potentially useful in situations where you find yourself repeatedly performing the same manual tasks in TeraPlot.
As an example, imagine you are required to create 6 surface plots laid out on a page in three rows of two, and that you may even be required to create multiple batches of such collections of plots. Rather than manually starting TeraPlot and performing all of the mouse clicks required to create six graphs, each containing a surface, you could write a short program which created the graphs automatically for you. Your program would first start TeraPlot and create a new TeraPlot document. Then, inside a loop which executed six times, you could create a new graph, positioned appropriately on the page, to which you would add a surface. If the surface was an analytical surface, it would be defined by a text string containing one or more expressions defining the surface. If the surface was tabular, it would be defined by an array of numbers representing its z values. Once all of the graphs had been created, the document could be programmatically saved and TeraPlot closed
The main program constructs by which these steps are achieved are the objects provided in the TeraPlot Object Model. For example,
in the case described above, TeraPlot would be started using the TApplication object. The document and page functionality would be
accessed using the TDocument and TPage objects. Finally, the graph and surface functionality would be accessed using the T3DGraph
and T3DSurfacePlot objects.
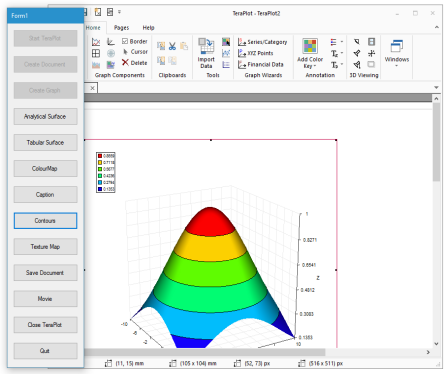
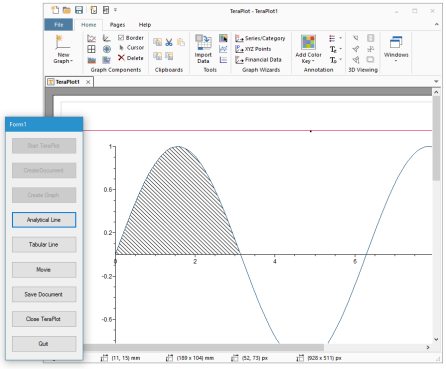
The two images shown here show screenshots of automation programs provided as examples with TeraPlot. In each case, the driving program
was written in C# and consists of a single form with a set of buttons demonstrating typical activities. In both forms, the top three buttons
are: Start TeraPlot, Create Document, Create Graph. Similarly, the bottom three buttons are Save Document,
Close TeraPlot, Quit. In between are buttons demonstrating tasks specific to the example. In the example above, a 2D line
plot with shading is demonstrated. The example to the left shows a surface with contour lines and contour shading being created.