Education
If you're an educator or student seeking function graphing software, you'll find TeraPlot an excellent tool for demonstrating
and exploring many mathematical concepts in 2D and 3D. In 2D, functions (or families of related functions), can be easily drawn
in cartesian, polar, and parametric coordinates. In addition, implicit function graphing can be performed by using
analytical contour plots to draw the 0 level contour of the function z = f(x, y). In 3D, equations of lines planes, quadric surfaces,
and any equation you care to define can be drawn and brought to life using options such colour mapping, transparency and text annotation.
The rotation/tilt parameters of 3D graphs can also be animated, and the animation optionally recorded to a movie file.
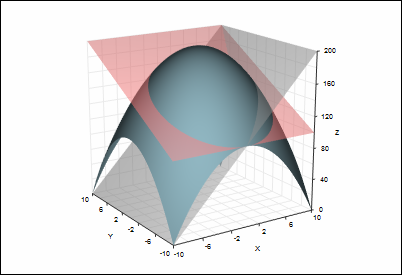
Plot of the function z = 200 - (x2 + y2) intersected by two planes drawn with transparency: z=5y+150 (red) and z=10x+100 (grey).
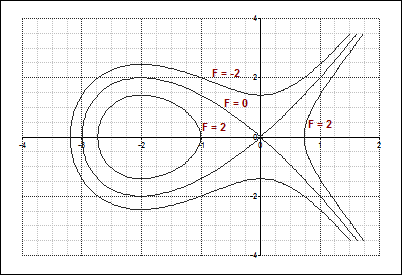
Implicit function. The Tschirnhausen cubic: F = x3+3x2-y2 = 0, drawn by plotting
F as a contour plot and displaying the F = 0 contour. Also shown are F = 2 and F = -2.
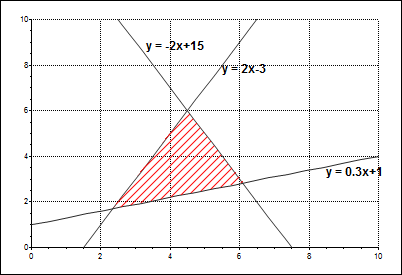
Three intersecting lines with shaded area, created by defining three plots for the lines, and an additional plot consisting of
the three intersect points, and shading it as a closed figure.
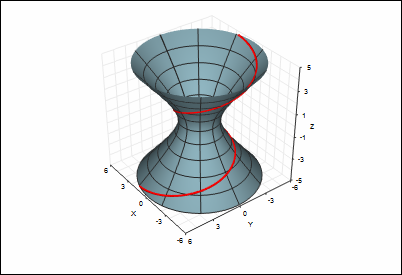
Two parametric plots. A surface plot of a hyperboloid, and a
3D line spiralling along its surface - just one example of
the versatility of TeraPlot when used as function graphing software.