Surface Plotting
TeraPlot has a wide range of surface plotting features. Surfaces can be based on tabular data and mathematical expressions within the same graph,
and plotted in cartesian, spherical, or cylindrical coordinate systems within the same graph. Display features include colour mapping, transparency, image overlay
and wireframe overlay. The figures below demonstrate some of these features.
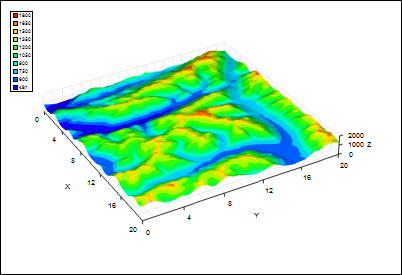
Colourmapped elevation data. The graph z axis range is larger than that of the x and y axes, and the z axis has been therefore been
scaled down to make all surface features clearly visible.
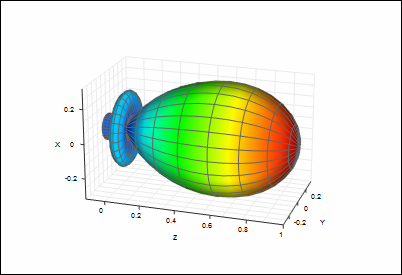
Polar plot of |sin(3θ)/(3θ)|, typical of e.g. antenna patterns. By default, this plot would "point" vertically. For effect, the
plot has been rotated through 90° and the graph axes relabelled.
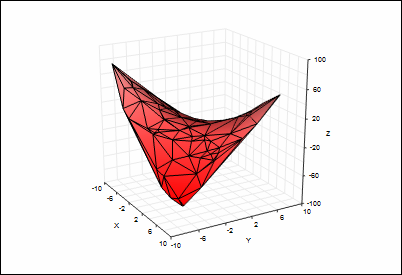
Graph containing surface plot of z = xy for 100 randomly generated (x, y) points in the range -10 to 10. The surface is composed of triangles generated
by Delaunay triangulation of the (x, y) values.
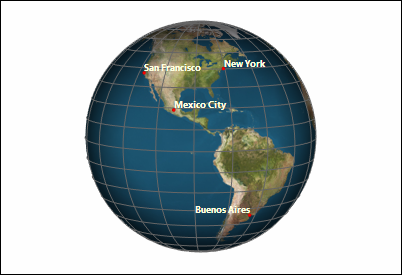
Example of image overlay, and also of using several plot types in the same graph. An image of the Earth has been overlaid on a surface plot
of the sphere r = 1. The graph axes have been omitted, scatter plot points have been used to mark the cities and a text plot has been used for the labels. Combined with 3D
lines, such a plot could for example be used to represent satellite ground tracks or aircraft flight paths.