Graph Wizards
TeraPlot provides Graph Wizards which allow complete annotated graphs to be created with just a few mouse clicks. Once started,
the graph wizard presents you with a set of input stages, the first of which is choice of plot type. This is followed by a data
entry stage, which is then followed by one or more additional graph parameters stages. When all data has been supplied, a preview
of the graph is displayed, and this can either be accepted, or previous stages can be returned to to make further enhancements. If
the final result is accepted, the new graph is created in a new TeraPlot project window. TeraPlot graph creation software provides
three graph wizards, described below.
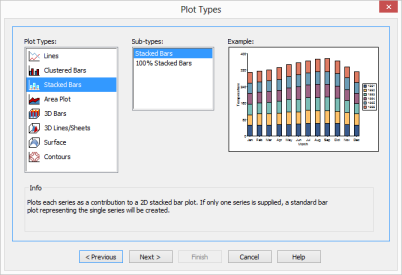
The Series/Category Graph Wizard helps automate graph creation
with data which takes the form of a collection of series plotted across a set of categories, with these terms having exactly the same
meaning as they do in Excel when referring to data plots. An example might be a requirement to plot the 12 average monthly temperatures for
six different years, giving 6x12 = 72 data points. In this case each set of 12 points representing the data for a given year would constitute
a series (giving 6 series in total), and the months themselves would represent the categories (giving 12 categories). In this case the number
of series was 6, but it can be as small as 1 or as large as hundreds.
View slideshow of wizard stages
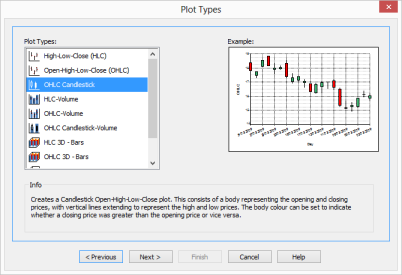
The Financial Data Graph Wizard helps automate graph creation
based on financial data. Available plot types include High-Low-Close (HLC) , HLC-Volume, Open-High-Low-Close (OHLC), OHLC-Volume,
OHLC Candlestick, and OHLC Candlestick-Volume. Data is presented to the wizard as a set of columns, with the first column representing the x values.
Depending on the plot type being created, this should then be followed by up to a further 3-5 columns representing opens, highs, lows etc.
The main plot types are 2D, but the option exists to plot HLC or OHLC data as 3D plots with the x values varying along the 3D graph x axis
and the HLC or OHLC data varying along the 3D graph y axis.
View slideshow of wizard stages
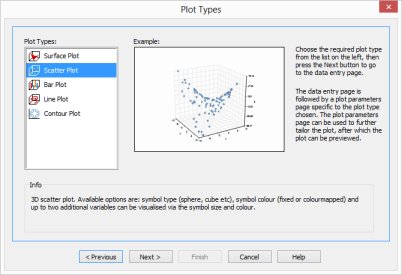
The XYZ Points Graph Wizard helps automate graph creation
based on data consisting of a list of (x, y, z) values. Typically, the x,y values of the points entered in this graph wizard will
be arbitrary, in that they won't lie on a regular grid of any sort. Available plot types are: Surface, Scatter, Bar, Line, and Contour. Each
plot type has its own dedicated parameters page in the graph wizard, allowing for a high degree of tailoring before previewing and creating
the graph.
Graph creation software wizard stages