Isosurface Plots
An isosurface plot is used to extract surfaces of constant w from a function of the form w = f(x, y, z), i.e. it is the 3d
equivalent of a contour plot. The data from which the isosurface plots are generated can be defined as a formula (analytical plot), or
loaded from a file. For an analytical plot, the data is assumed to lie on a regular rectangular 3D grid. For data loaded from a file,
the data can either lie on a regular grid, or arbitrary individual cells can be specified. Some typical isosurface plots are shown below.
Acknowledgements to Implicit Equations 3D Grapher isosurface software for several of the formulas used below.
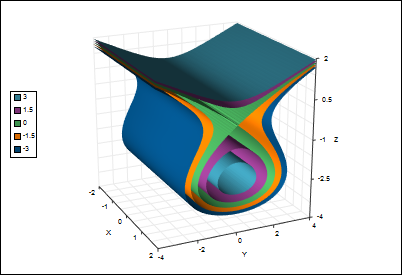
3D version of the Tschirnhausen cubic, redefined as w = z3+3z2-y2. Five
isosurfaces have been plotted, with the 0 level isosurface representing the implicit equation.
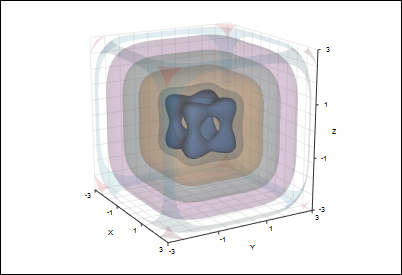
Isosurfaces of the function w = x4+y4+z4 - (x2+y2+z2 - 0.4). The 0 level
isosurface has been plotted solid, with the others plotted transparent.
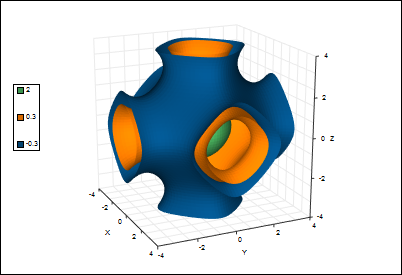
Isosurfaces of the function w = cos(x) + cos(y) + cos(z).
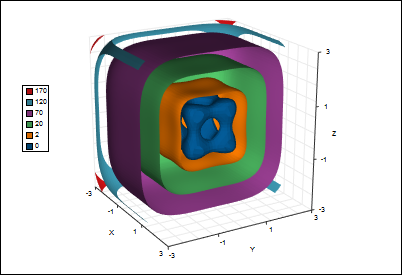
The same function as the transparent plot above, this time using slightly different isosurface values, and plotted over a limited range in the
x direction to give a "cut-away" effect.