3D Scatter Plots
The 3d scatter plot displays a set of points as symbols within an xyz coordinate system. It can be used
on its own, but it's is also useful in combination with other plot types, e.g. in situations where
specific points need to be highlighted and annotated. By making use of point colour and size, up to five variables can be
visualized. In addition, categories can be created by using multiple scatter plots within the same graph, each with a different symbol type.
The figures below illustrate some of these points.
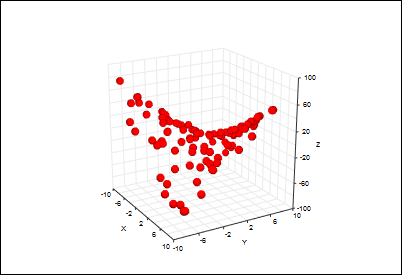
Basic default plot of 100 points randomly selected from the function z = xy over the ranges -10 to 10 in x and y. By default, the
points are displayed as red spheres.
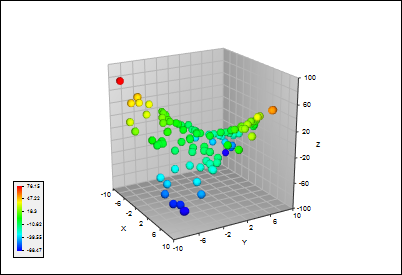
The points in this figure have the same positions as the figure to the left, but they're now coloured acording to
z value by applying a colourmap.
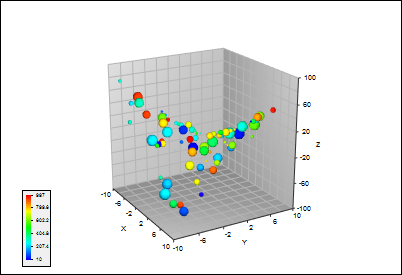
The points here again have the same positions as before, but two additional data values (random
numbers between 1 and 1000) have been associated with each point, and visualized via symbol size and colour.
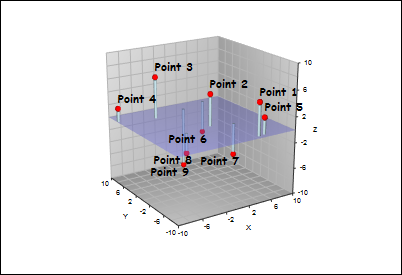
Example of combining a 3d scatter plot with other plot types to create a multidimensional analysis diagram. In this case, vertical
lines have been dropped from the points to a user-defined baseline. A surface has then been
added to create a transparent plane at the baseline. Finally, 3d text has been added to annotate the points.
Features available in the 3d scatter plot include:
-
Choice of coordinates. Point positions can be specified in cartesian, polar or cylindrical coordinates.
-
Visualization of additional variables. Up to two additional data values can be associated with each point and visualized via
point size and colour.
-
Symbol display. Symbols can be displayed as spheres, cones, or cubes. Symbols can also be scaled in size and vertically aligned
relative to the data point.
-
Vertical lines. Vertical lines can optionally be dropped from each point to a user defined baseline z value.