Plot Types - 2D Graphing
The list below summarises the 2D plot types available in TeraPlot graphing software. Any subset of the plot types listed below can be combined together in a single graph.
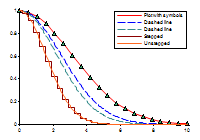
Line Plot. Joins a set of (x, y) points as straight line segments. The x values can be arbitrary
or lie on a regularly spaced grid. Symbols can optionally be displayed at the points, and line styles such as thickness
and dash pattern can be set. Shading underneath the line can be displayed over an arbitrary range relative to an arbitrary
baseline. The option also exists to display the plot as stepping between the points rather than straight line segments.
Because line plots can be analytical (i.e. based on mathematical expressions) as well as tabular, it's a simple matter
with TeraPlot graphing software to plot a set of experimental points along with a formula they may correspond to.
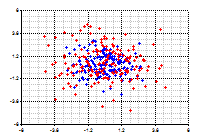
Scatter Plot. Places a symbol at each (x, y) point in the plot. Symbols can be arbitrarily scaled, and the
fill colour and and border colour set. The fill colour can be displayed as solid or patterned.
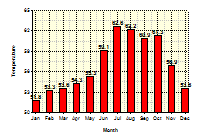
Bar Plot. Draws a bar of height y at each of the plot's x points. The bar fill colour and and border colour
can be set, and the fill colour displayed as solid or patterned. The graph on the right shows a bar plot combined with a
text plot, which is used to label the bars with their corresponding heights.
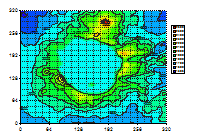
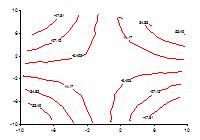
Contour Plot - Regular Grid. Draws contours and/or colourmapped levels associated with a function of the form z = f(x,y)
defined on a regular (x, y) grid. Options exist to draw contours only, colourmapped levels only, or to simply display the continuous
colourmapped function. Contour labels can optionally be displayed, with a wide range of configuration options such as font, scaling,
orientation, and foreground and background colour. Because contour plots in TeraPlot graphing software can be analytical, i.e.
based on mathematical expressions,
they can be used to draw implicit functions of the form f(x, y) = 0. For example, plotting xy - 5 = 0, would involve plotting
z = xy - 5, and displaying the z = 0 contour value. Families of such plots can easily be plotted by displaying multiple contours.
Contour Plot - Irregular Data. Graphs contours and/or colourmapped levels associated with a function of the form z = f(x,y)
defined at arbitrary (x, y) points. All of the options described above for the regular grid contour plot are also available for this plot.
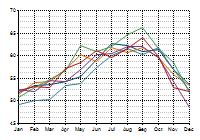
Line Series Plot. Graphs a set of line plots, all of which share the same x values. This plot is drawn
using the Series/Category Graph Wizard. The individual lines plots have options identical to the line plot described above.
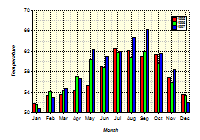
Clustered Bar Plot. This plot is created using using the Series/Category Graph Wizard, and draws each series as
a set of bars clustered around each x (category) value.
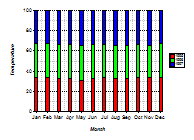
Stacked Bar Plot. This plot is created using using the Series/Category Graph Wizard, and draws each series as
a set of vertically stacked bars located at x (category) value.
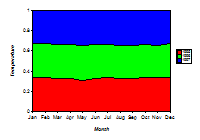
Area Plot. This plot is created using using the Series/Category Graph Wizard, and draws a set of vertically stacked areas,
each area corresponding to a series.
Text Plot. Draws an arbitrary piece of text at each of the plot's (x, y) points. The text plot is usually used along with
other plot types to provide annotation at specific points in a graph. Each plot point is defined by an x value, a y value, and a piece of text,
and various options exist to set text font, scaling, and text alignment relative to the (x, y) location.
Error Bar Plot. Draws an error bar at each of the plot's (x, y) points.