Contour Plotting
Contour plotting is available in
both 2D and 3D graphs. Contour plots can
be based on tabular data or mathematical expressions within the same graph, and the contour plot data can lie on a regular grid
or at random (x, y) points. Various contour annotation options are available, such as the ability to specify the contour label font, and whether the labels have solid backgrounds
and/or borders. Contour lines alone can be displayed, or they can be combined with contour shading. Contours can also be displayed
on surfaces, as illustrated in one of the graphs below.
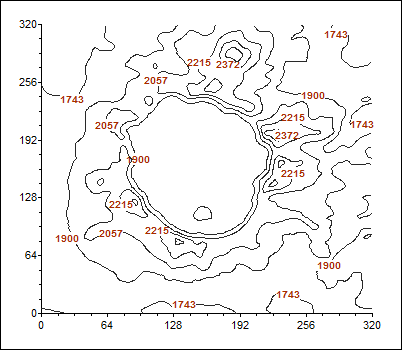

Contour plot of elevation data based on a regular x-y grid.
Surface plot/contour plot of the same data as the plot on left, with the same contours displayed. Graph walls are displayed.
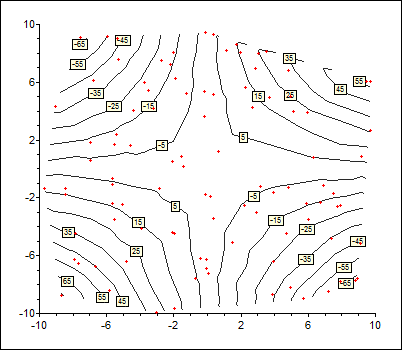
Graph showing irregular data contour plot of z = xy for 100 randomly generated (x, y) points in the range -10 to 10. The points are displayed in red.
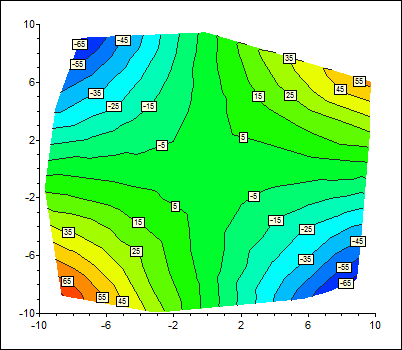
In the above plot, shaded contours have been added to the plot on the left, and display of the points removed.